Manage your accounting, get invoices paid, accept payments and much more with QuickBooks Connector for MarketSharp .
Know your construction project numbers and gain a 360-degree view of your business. All with customizable reporting and performance construction dashboards. Whether in the office, field, or at home, nothing beats having all your company’s leading indicators and performance numbers at a glance. That’s exactly what you’ll find with MarketSharp’s built-in project dashboards, views, and reports. No need to be a stats geek, it’s all automatic!

You’ve heard it over and over again. “Knowing your numbers” can put you in a position to manage your construction projects much more efficiently and profitably. Make better decisions by monitoring performance in real time.
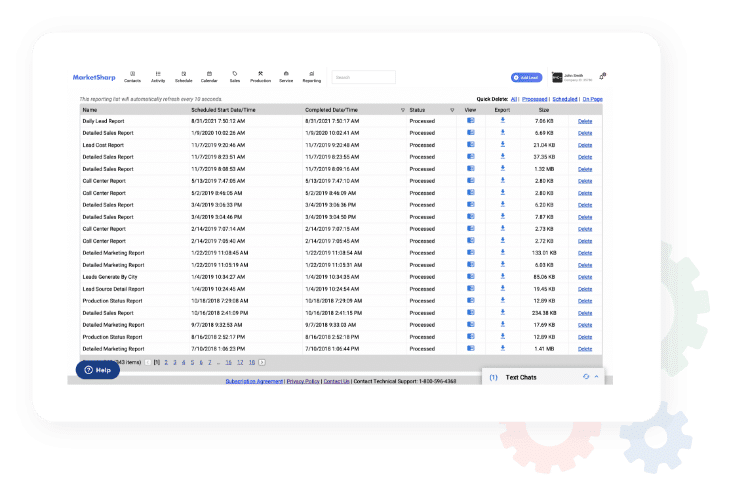
Get the data you need, exactly how you need it. Run hundreds of real-time reports; create, save and share custom reports, and have the visibility into your business you didn’t know you needed.


No more spending your day copying and pasting numbers into Excel documents. Get the construction project reports you need, when you need them, and spend less time on project management! Discover the value of automated reporting with MarketSharp.
Manage your business with apps and integrations you can’t live without.
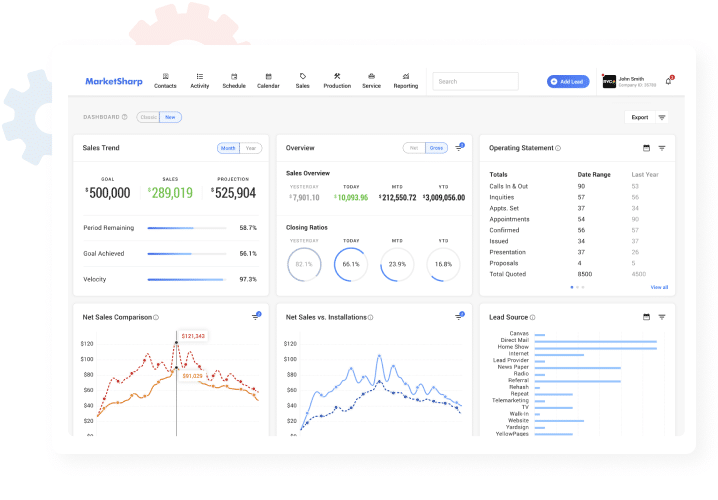
Performance dashboards give you a birds-eye view into important metrics for your construction project status. View your top sales, marketing, revenue, and job performance at a glance to identify any wins or opportunities for improvement.
The Real-Time Performance Dashboard enables contractors to make better decisions through data. With the dashboard, you can quickly identify which areas of your construction business are performing well and where you should invest more. For example: contractors can easily track and monitor certain lead sources or areas. You can also keep an eye on areas of your business that are struggling and need extra support like sales conversions or job costs. The dashboard allows you to stay on top of project health and make better decisions more quickly.
Yes! Our construction dashboards allow you to see your top performance metrics all in one place right when you log into the software. This way, you can quickly view your most important metrics all on one page. You’ll be able to be even more profitable by knowing how to allocate your resources better.
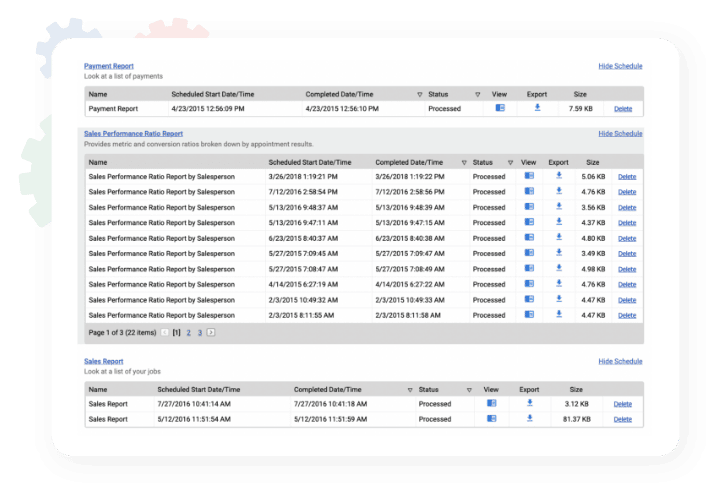
With our customizable reporting feature, you can pull reports on any data within your MarketSharp account. This could be reports on specific products or services you offer, job costing, revenue by lead sources, or more. Get the tailored reports you need to support and monitor the success of all your construction projects.
Automated Reporting saves time when planning and managing your construction projects by optimizing your workflow. If you have reports you love, you can have them automatically pulled and sent to you! For example, if you want to see lead reports every morning, you can have those scheduled. Or, you can have monthly revenue reports sent directly to your inbox.
Our construction dashboard makes it easy to track and monitor the following metrics:
For your construction projects, analytics such as “marketing ROI by lead source” help you to determine which channels are working well. This way, you know where to invest more money or where you need to pivot. It also helps improve construction operations with job costs, finding ways to reduce expenses or increase your margins. You can also see where there are inefficiencies in the production process and work to find solutions.
MarketSharp offers onboarding training to help tailor our construction dashboard to best suit your unique business needs. We also offer a help center with readable articles and videos. Lastly, we offer live customer support ready to answer and and all questions. For more information, book a free demo with our team today.

Sign up to receive new blog posts and webinar announcements by email.
Copyright © MarketSharp. All Rights Reserved. | Privacy Policy | Terms & Conditions